
Understanding Pressure, Flow, and Performance Curves of PD Blowers
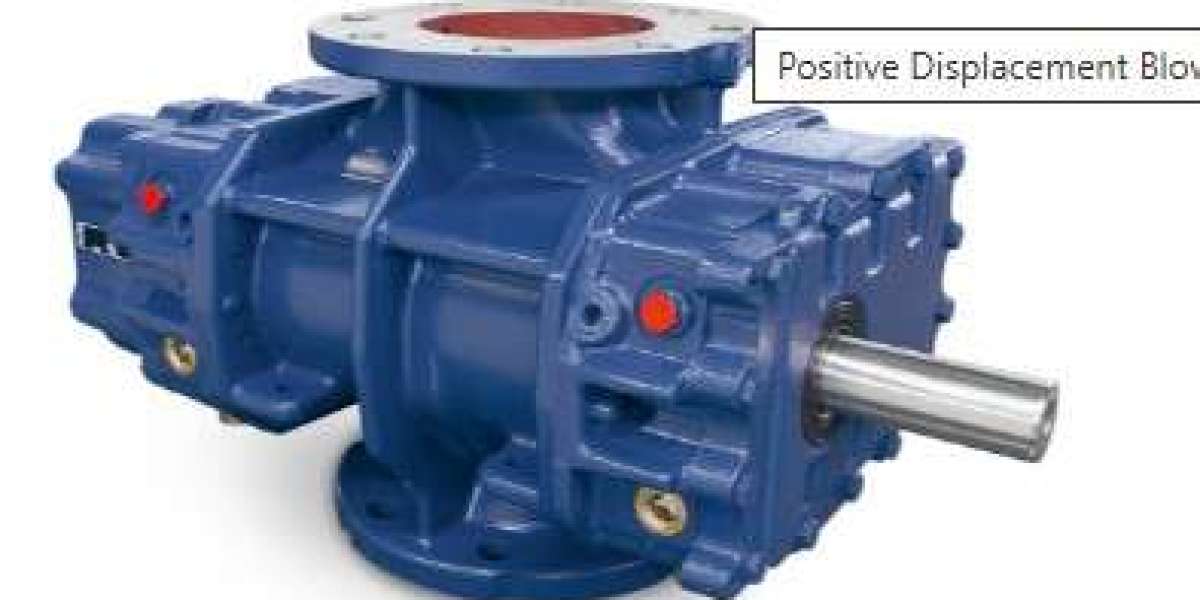
Positive displacement blowers play a vital role in many industrial applications where consistent airflow, stable pressure, and reliable performance are required. From wastewater treatment and pneumatic conveying to cement plants and chemical processing, understanding how a Positive Displacement Blower behaves under different operating conditions is essential for engineers, operators, and maintenance teams.
One of the most important tools for understanding and selecting a PD blower is its performance curve. These curves visually describe the relationship between pressure, flow, power, and efficiency. However, many users operate blowers without fully understanding what these curves represent or how to interpret them correctly. This article explains pressure, flow, and performance curves of PD blowers in a clear, practical, and human-centered way.
What Is a Positive Displacement Blower?
A Positive Displacement Blower is a type of machine that moves a fixed volume of air or gas per revolution. Unlike centrifugal blowers, which depend on velocity to generate pressure, PD blowers trap air between rotating elements and push it from the inlet to the outlet.
Common types include:
Roots blowers
Rotary lobe blowers
Screw blowers
Vane blowers
Because the volume displaced per revolution is nearly constant, PD blowers deliver relatively constant airflow regardless of changes in system pressure. This unique characteristic is what makes their pressure and flow relationships different from other blower types.
The Fundamental Relationship Between Pressure and Flow
In a Positive Displacement Blower, flow is primarily determined by:
Blower size
Rotational speed (RPM)
Pressure, on the other hand, is not generated by the blower itself but by resistance in the system. As system resistance increases, pressure rises, and the blower must work harder to overcome it.
Key Principle:
Flow is controlled by speed
Pressure is controlled by system resistance
This principle is essential when interpreting performance curves and diagnosing operating issues.
Understanding Pressure in PD Blowers
Pressure in PD blower systems is typically measured as:
Differential pressure (inlet to outlet)
Expressed in bar, kPa, psi, or mmWC
Sources of Pressure
Pressure builds up due to:
Pipe length and diameter
Filters and silencers
Valves and bends
Process equipment
Material being conveyed
A Positive Displacement Blower will continue to deliver air even as pressure increases, up to its design limit. This is why pressure relief valves and safety systems are critical to prevent overload.
Understanding Flow in PD Blowers
Flow is usually expressed in:
m³/hr
CFM
Nm³/hr
Unlike centrifugal blowers, PD blowers maintain nearly constant flow across a wide pressure range. However, real-world factors such as internal leakage (slip) and temperature can cause slight flow reductions at higher pressures.
Volumetric Efficiency
As pressure increases:
Internal leakage increases
Volumetric efficiency decreases
Actual delivered flow slightly drops
This behavior is captured in performance curves.
What Are Performance Curves?
Performance curves are graphical representations provided by manufacturers that show how a Positive Displacement Blower performs under various operating conditions. These curves help users:
Select the correct blower size
Predict operating Flow vs. Pressure Curve Explained
The flow vs. pressure curve for a Positive Displacement Blower looks very different from that of a centrifugal blower.
Characteristics:
Nearly vertical line
Minimal change in flow as pressure increases
Sharp pressure rise when flow is restricted
This means that if a discharge valve is partially closed, the blower will not significantly reduce flow. Instead, pressure will rPower Curve and Its Importance
As pressure increases, the power required to drive the blower increases almost linearly.
Why Power Rises:
Higher pressure means more work is required to move the same volume of air
Increased mechanical and thermal losses
Higher discharge temperatures
Power curves show:
Brake horsepower (BHP)
Motor sizing requirements
Overload conditions
Selecting a motor without understanding the power curve can result in frequent trips or long-term damage.
Efficiency Curves and Real-World Performance
Efficiency curves indicate how effectively a Positive Displacement Blower converts input power into useful airflow.
Types of Efficiency:
Volumetric efficiency
Mechanical efficiency
Overall efficiency
Efficiency is highest within a specific operating window. Operating far outside this range can cause:
Excessive heat
Higher energy costs
Reduced blower life
Understanding efficiency curves allows operators to optimize system design and reduce operating expenses.
Speed Lines and Variable Operation
Performance curves often include multiple speed lines, each representing blower performance at a specific RPM.
Why Speed Matters:
Increasing speed increases flow
Pressure capability remains limited by design
Power consumption rises sharply with speed
With variable frequency drives (VFDs), users can adjust speed to match demand. Performance curves help predict how changes in speed will affect pressure, flow, and power.
System Curve vs. Blower Curve
A system curve represents how pressure changes with flow due to system resistance. The operating point of a Positive Displacement Blower occurs where:
Blower capability
System resistance
intersect.
Unlike centrifugal systems, the operating point of a PD blower is less flexible. Changes in system resistance mostly affect pressure, not flow.
Understanding both curves together helps avoid:
Excessive pressure
Energy waste
Mechanical stress
Temperature Rise and Its Effect on Performance
As pressure increases, discharge temperature also rises. High temperatures affect:
Lubrication
Seal life
Material integrity
Performance curves often assume standard inlet conditions. Real-world deviations such as high inlet temperature or altitude must be considered when interpreting curves.
Common Mistakes When Reading PD Blower Curves
Many operational problems stem from misunderstanding performance data. Common mistakes include:
Ignoring maximum allowable pressure
Selecting based on flow only
Oversizing the blower
Underestimating power requirements
Not accounting for future system expansion
A well-understood performance curve prevents these issues before installation.
How Performance Curves Help in Blower Selection
When selecting a Positive Displacement Blower, performance curves allow engineers to:
Confirm required flow at operating pressure
Ensure motor capacity is sufficient
Verify efficiency at design conditions
Check safe operating limits
Proper interpretation leads to:
Lower energy consumption
Longer equipment life
Stable process operation
Role of Performance Curves in Troubleshooting
Performance curves are not only for selection; they are powerful diagnostic tools.
They help identify:
Unexpected pressure increases
Flow restrictions
Worn internal components
System modifications affecting operation
Comparing actual operating data with curve predictions quickly reveals abnormalities.
Maintenance and Long-Term PerformanceOver time, internal clearances increase due to wear, reducing volumetric efficiency. Performance curves provide a baseline for:
Monitoring degradation
Planning maintenance
Deciding overhaul intervals
Tracking deviations from expected performance ensures reliable long-term operation of the Positive Displacement Blower.
Final Thoughts
Understanding pressure, flow, and performance curves of PD blowers is not just a technical exercise; it is a practical skill that directly impacts system reliability, safety, and operating costs. A Positive Displacement Blower behaves differently from other blower types, and its unique characteristics demand careful attention to performance data.